Newplot
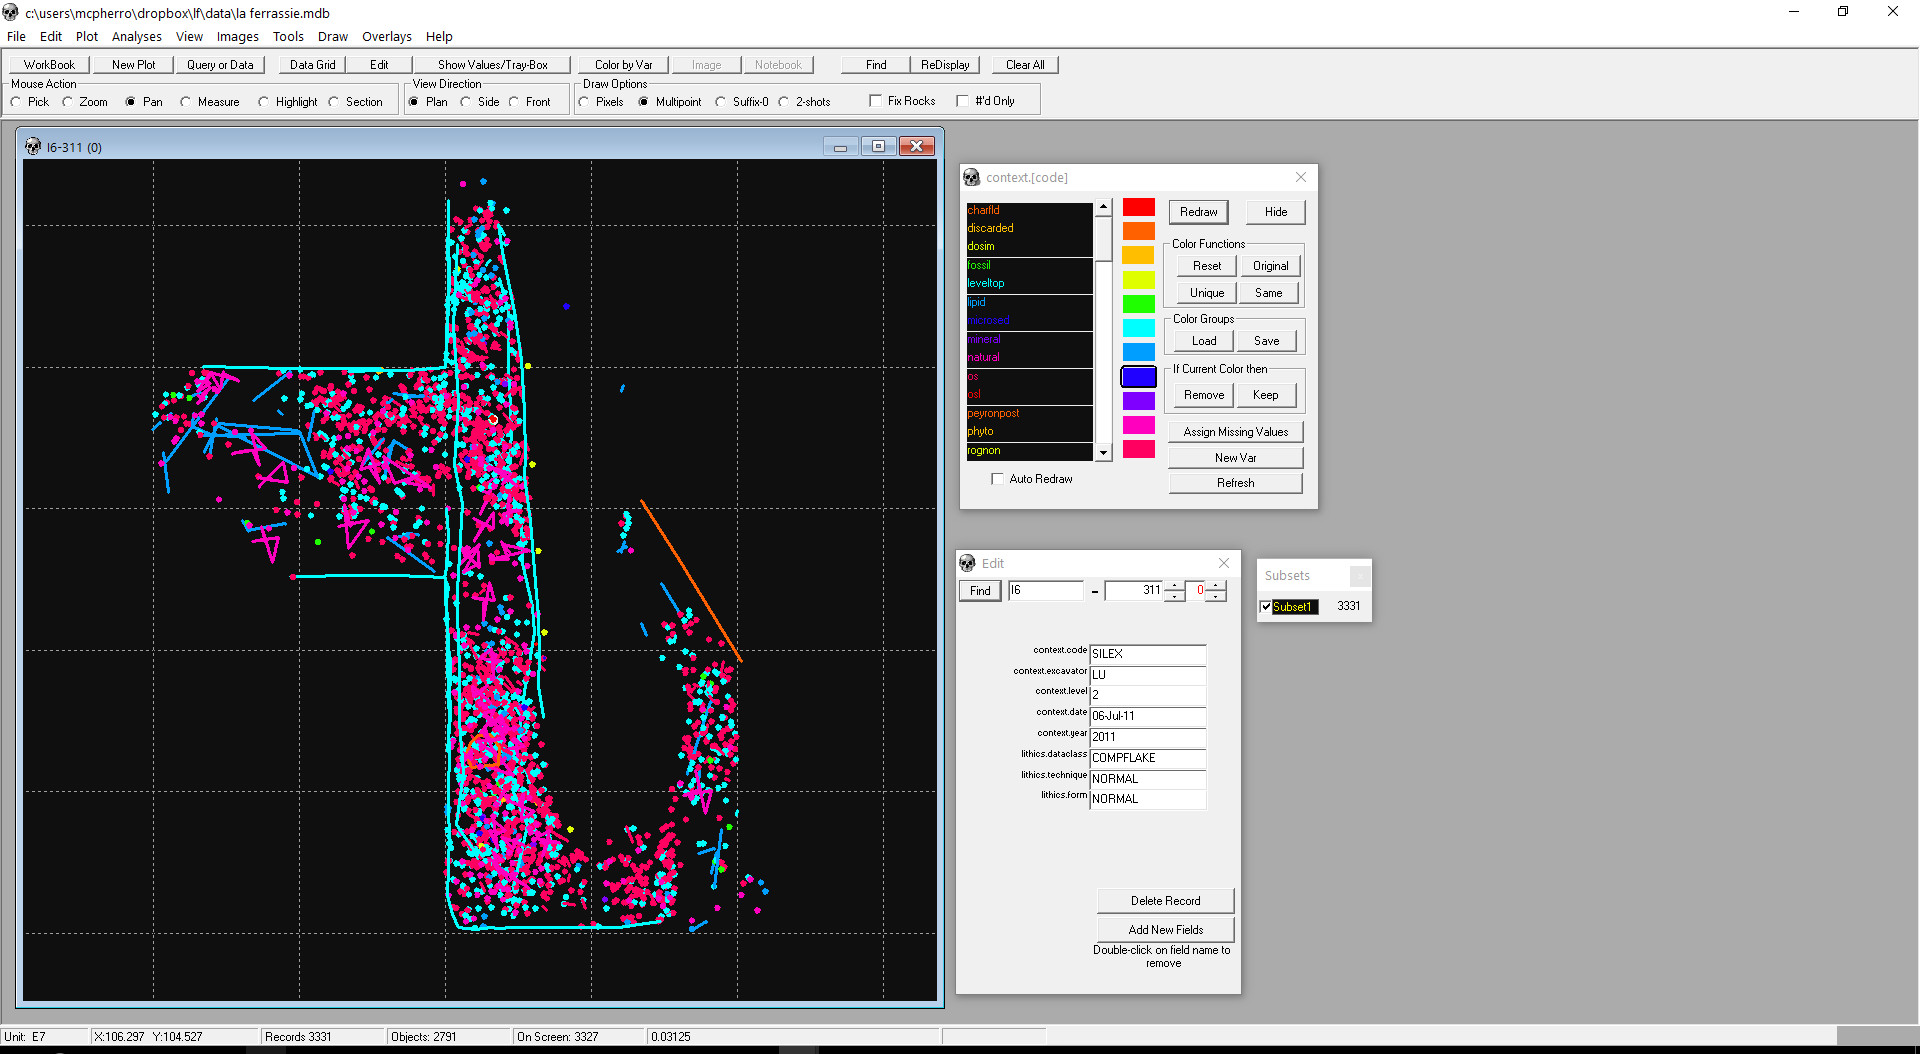
NewPlot is a Windows based program for working with piece provenienced artifact data. Development on the program started in 1986 by Harold Dibble at the Paleolithic site of La Quina (France). He was motivated by the need to plot points coming from the total station system he had put in place there. Starting in 1987, Harold Dibble and Shannon McPherron worked on it together at La Quina, Combe-Capelle Bas, Fontéchevade, Pech de l'Azé IV, Roc de Marsal, La Ferrassie and many other sites along the way. The program has been adapted by others to work with their own sites. It is intended to work in conjunction with the total station (EDM) programs and the data entry programs (E4/E5). It is also intended to handle barcoding printing for the field and for the laboratory.
To install the program, first run the setup program. Once this is done, replace the version of the program that is installed with the version you can download here. In other words, the install put the libraries in place, but you should use the latest version of the program. I can't say it is without bugs. It certainly has bugs. But I can say that it is still used on many OSA and other projects. As with a lot of our software, it takes a bit of effort at the start to get it up and running, but after that it tends to work.
Normally two datasets are already available for the program (Combe-Capelle Bas and Fontéchevade), but I need to update the web site to post these again. In the mean time, there is some explanation of the database structure below. Note, the program uses Microsoft Access for its databases. McPherron has had some thought to rewrite portions of this program in a more modern format, but that is a bit more work than he can take on just now.
These days the way McPherron uses the program is to collect data from the total station and from data entry (lithic analysis, for instance) into one database. NewPlot is then very useful for examining the data in 3D with color-coding from database fields. So, for instance, after each data transfer of total station data, we plot the points in plan and section view with color coding by object type and layer to make sure everything looks right. We also use the program to manage our barcodes, and quite a few other basic tasks. But when it comes to final output or analyses, these days McPherron exports the data to R. QGIS is an effective alternative as well for viewing the data.
Bug Fixes:
March, 2022 - Windows 10 and 11. New installations on Windows 10 and 11 can have some crashes. I think I have identified the components that are crashing the program, and I am working to write them out of the current version. The newest version fixes a problem in Edit Plotfiles. This version also improves a number of screen formatting issues.
Using NewPlot with EDM-Mobile:
EDM-Mobile creates a database format that NewPlot cannot use without the installation of an additional Microsoft library. So in addition to installing NewPlot, you will need to download and install this library linked here.
| Description | Filename | Size> |
| Download the installation and program | newplot_setup.exe | 27 mb |
| Download the latest version of Newplot Updated March, 2022 |
newplot.exe | 3.4 mb |
Converting Data
Plot reads Microsoft Access databases. What follows is a basic description of how to convert your database to a Plot/Newplot compatible database. It assumes that you have some knowledge of how to work with Access.
1) Only two tables are required: XYZ and Context. Plot/Newplot will automatically add the other required tables.
2) XYZ must include the following fields:
Unit, Text, Length=6
ID, Text, Length=5
Suffix, Numeric, Integer (default value must be 0)
X, Numeric, Single precision
Y, Numeric, Single precision
Z, Numeric, Single precision
RecordCounter, Number, Integer or Long Integer
3) Context must include the following fields:
Unit, Text, Length=6
ID, Text, Length=5
4) Context should also include:
Level, Text, Lenth=10 (minumum - can be larger)
This related table database structure allows multiple XYZ points to be associated with a single artifact record in the Context table. Typically information about the date the object was excavated, the kind of the objects, the level it was in, and who excavated it would be included in the Context table. To link more than one XYZ measurement to an object, place multiple entries in the XYZ table with the same Unit and ID but increment Suffix (0=first point, 1=second point, etc.).
If you have all of your data in a single table, take the following steps to quickly convert it.
1) Make a copy of the table from within Access and call it XYZ.
2) Make a second copy of the table from within Access and call it Context.
3) Alter the field names and lengths in the Context and XYZ tables as described above and as appropriate. You do not need to delete X, Y, and Z fields from Context, though if you retain them it might start to get confusing.
If you have other tables within your database with related information on each artifact, Newplot can use them as long as they also contain Unit and ID formatted in exactly the same way.
If these instructions do not work, please let McPherron know.